Pictures
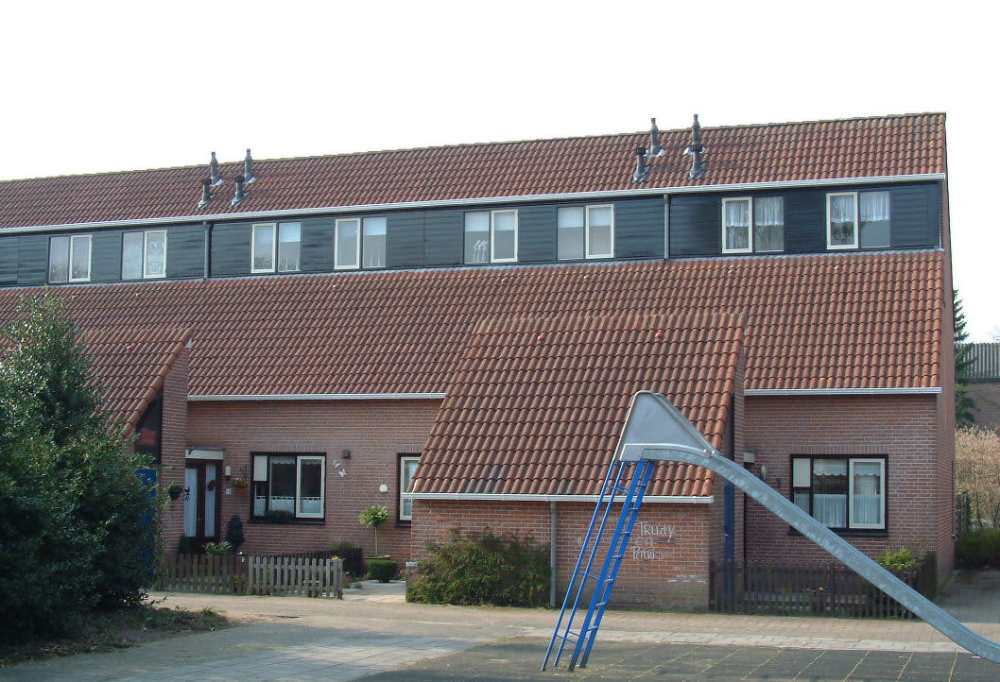
Klaver 16 in Bilthoven
- Unlisted
Property main details
€ 731 /month
- 109 m²
- 3 bedrooms
- Shell
Timeline
- 05 Sep 2025
- 13 Sep 2025Unlisted
AI Summary
Property
- Bathrooms
- 1
- Energy label
- A
- Floor
- Ground floor
Availability
- Tenant selection
- Waitlist
- Detected
- 10 Sep 2025
- Available from
- 30 Sep 2025
- Short-term
- No
- React until
- 12 Sep 2025
- Viewing possible
- Yes
Legal
- Contract type
- Model A
- Contract termination
- Initial fixed term, then 1 month
- Registration allowed
- Not mentioned
- WWS points
- Not specified
Building
- Built in
- 1983
- Elevator
- No
- Solar panels
- Not mentioned
Financials
- Deposit
- Not mentioned
- Service costs
- € 6 /month
- Utilities included
- Not mentioned
- Estimated energy cost
- € 222 /month
- Rental allowance
- No
Requirements
- Available for
- Everyone
- Pets
- No restrictions
- Kids
- No restrictions
- Students
- No restrictions
- Entrepreneurs
- Allowed
- Min annual income
- No explicit requirements, usually 3.5x monthly rent
- Max annual income
- Single: € 49669Couple: € 54847
- Age
- Any age welcome
- Guarantors
- No restrictions
- Sharing
- Not allowed
- Max household size
- No requirements
- Sex restrictions
- Everyone welcome
- Language
- Everyone welcome
- Residence permit min valid for
- No requirements
Description, briefly
Spacious terraced house with a large hall, half open kitchen, living room, three bedrooms, bathroom with shower, and both front and back gardens. Includes extra storage space and a shed; located on the ground floor.
Location, briefly
Located in the De Leijen neighborhood, close to the forests of Bilthoven, with a supermarket and bus stop within walking distance. The train station and shopping area of Bilthoven are also easily accessible by bike.
Reviews of Klaver 16
0 reviews
You will remain anonymous, and your name will not be visible.
Places in 1km radius around Klaver 16
Uprent is retrieving the location...
Population of De Leijen (Neighborhood)
- Population
- 4835
- Men
- 2,280 (47.1%)
- Women
- 2,560 (52.9%)
De Leijen - Age
- 0-15
- 15.9%
- 15-25
- 8.8%
- 25-45
- 19.8%
- 45-65
- 25.1%
- 65+
- 30.5%
Crime in De Leijen in 2024
- Violent crime
- 3.309203722854188
- Non-violent crime
- 25.439503619441574
Public safety
- Public nuisance: 1
- Drug & alcohol nuisance: 0
- Neighborhood nuisance: 0
- Public order disturbance: 0
- Fireworks nuisance: 1
- Trespassing: 0
- Road safety: 8
- Road accidents: 7
- Driving under influence: 1
- Other road offenses: 0
Theft & Damage
- Petty theft: 2
- Shoplifting: 2
- Pickpocketing: 0
- Vandalism: 8
- Transport theft: 74
- Theft in public transport: 17
- Bike & scooter theft: 44
- Car break-ins: 10
- Car theft: 3
- Burglary: 14
- Sheds & garages: 5
- Businesses: 1
- Homes: 8
Violent crime
- Robbery: 1
- Public robbery: 0
- Indoor robbery: 1
- Threat: 3
- Assault: 5
- Group violence: 7
- Homicide: 0
- Arson: 0
- Sexual offense: 0
De Leijen - Origin
- NL
- 74.1%
- EU
- 6.0%
- Non-EU
- 19.9%
Population of De Leijen (District)
- Population
- 4835
- Men
- 2,275 (47.1%)
- Women
- 2,560 (52.9%)
De Leijen - Age
- 0-15
- 15.9%
- 15-25
- 8.8%
- 25-45
- 19.8%
- 45-65
- 25.2%
- 65+
- 30.5%
Crime in De Leijen in 2024
- Violent crime
- 3.309203722854188
- Non-violent crime
- 25.439503619441574
Public safety
- Public nuisance: 1
- Drug & alcohol nuisance: 0
- Neighborhood nuisance: 0
- Public order disturbance: 0
- Fireworks nuisance: 1
- Trespassing: 0
- Road safety: 8
- Road accidents: 7
- Driving under influence: 1
- Other road offenses: 0
Theft & Damage
- Petty theft: 2
- Shoplifting: 2
- Pickpocketing: 0
- Vandalism: 8
- Transport theft: 74
- Theft in public transport: 17
- Bike & scooter theft: 44
- Car break-ins: 10
- Car theft: 3
- Burglary: 14
- Sheds & garages: 5
- Businesses: 1
- Homes: 8
Violent crime
- Robbery: 1
- Public robbery: 0
- Indoor robbery: 1
- Threat: 3
- Assault: 5
- Group violence: 7
- Homicide: 0
- Arson: 0
- Sexual offense: 0
De Leijen - Origin
- NL
- 74.0%
- EU
- 6.0%
- Non-EU
- 20.0%
Population of Bilthoven (City)
- Population
- 23220
- Men
- 11,065 (47.6%)
- Women
- 12,160 (52.4%)
Bilthoven - Age
- 0-15
- 17.4%
- 15-25
- 9.9%
- 25-45
- 19.3%
- 45-65
- 26.7%
- 65+
- 26.7%
Crime in Bilthoven in 2024
- Violent crime
- 3.143841515934539
- Non-violent crime
- 27.174849267872524
Public safety
- Public nuisance: 5
- Drug & alcohol nuisance: 0
- Neighborhood nuisance: 0
- Public order disturbance: 1
- Fireworks nuisance: 3
- Trespassing: 1
- Road safety: 79
- Road accidents: 52
- Driving under influence: 22
- Other road offenses: 5
Theft & Damage
- Petty theft: 11
- Shoplifting: 11
- Pickpocketing: 0
- Vandalism: 75
- Transport theft: 304
- Theft in public transport: 58
- Bike & scooter theft: 133
- Car break-ins: 106
- Car theft: 7
- Burglary: 94
- Sheds & garages: 16
- Businesses: 10
- Homes: 68
Violent crime
- Robbery: 4
- Public robbery: 3
- Indoor robbery: 1
- Threat: 25
- Assault: 29
- Group violence: 11
- Homicide: 1
- Arson: 3
- Sexual offense: 0
Bilthoven - Origin
- NL
- 74.6%
- EU
- 7.0%
- Non-EU
- 18.4%