Pictures
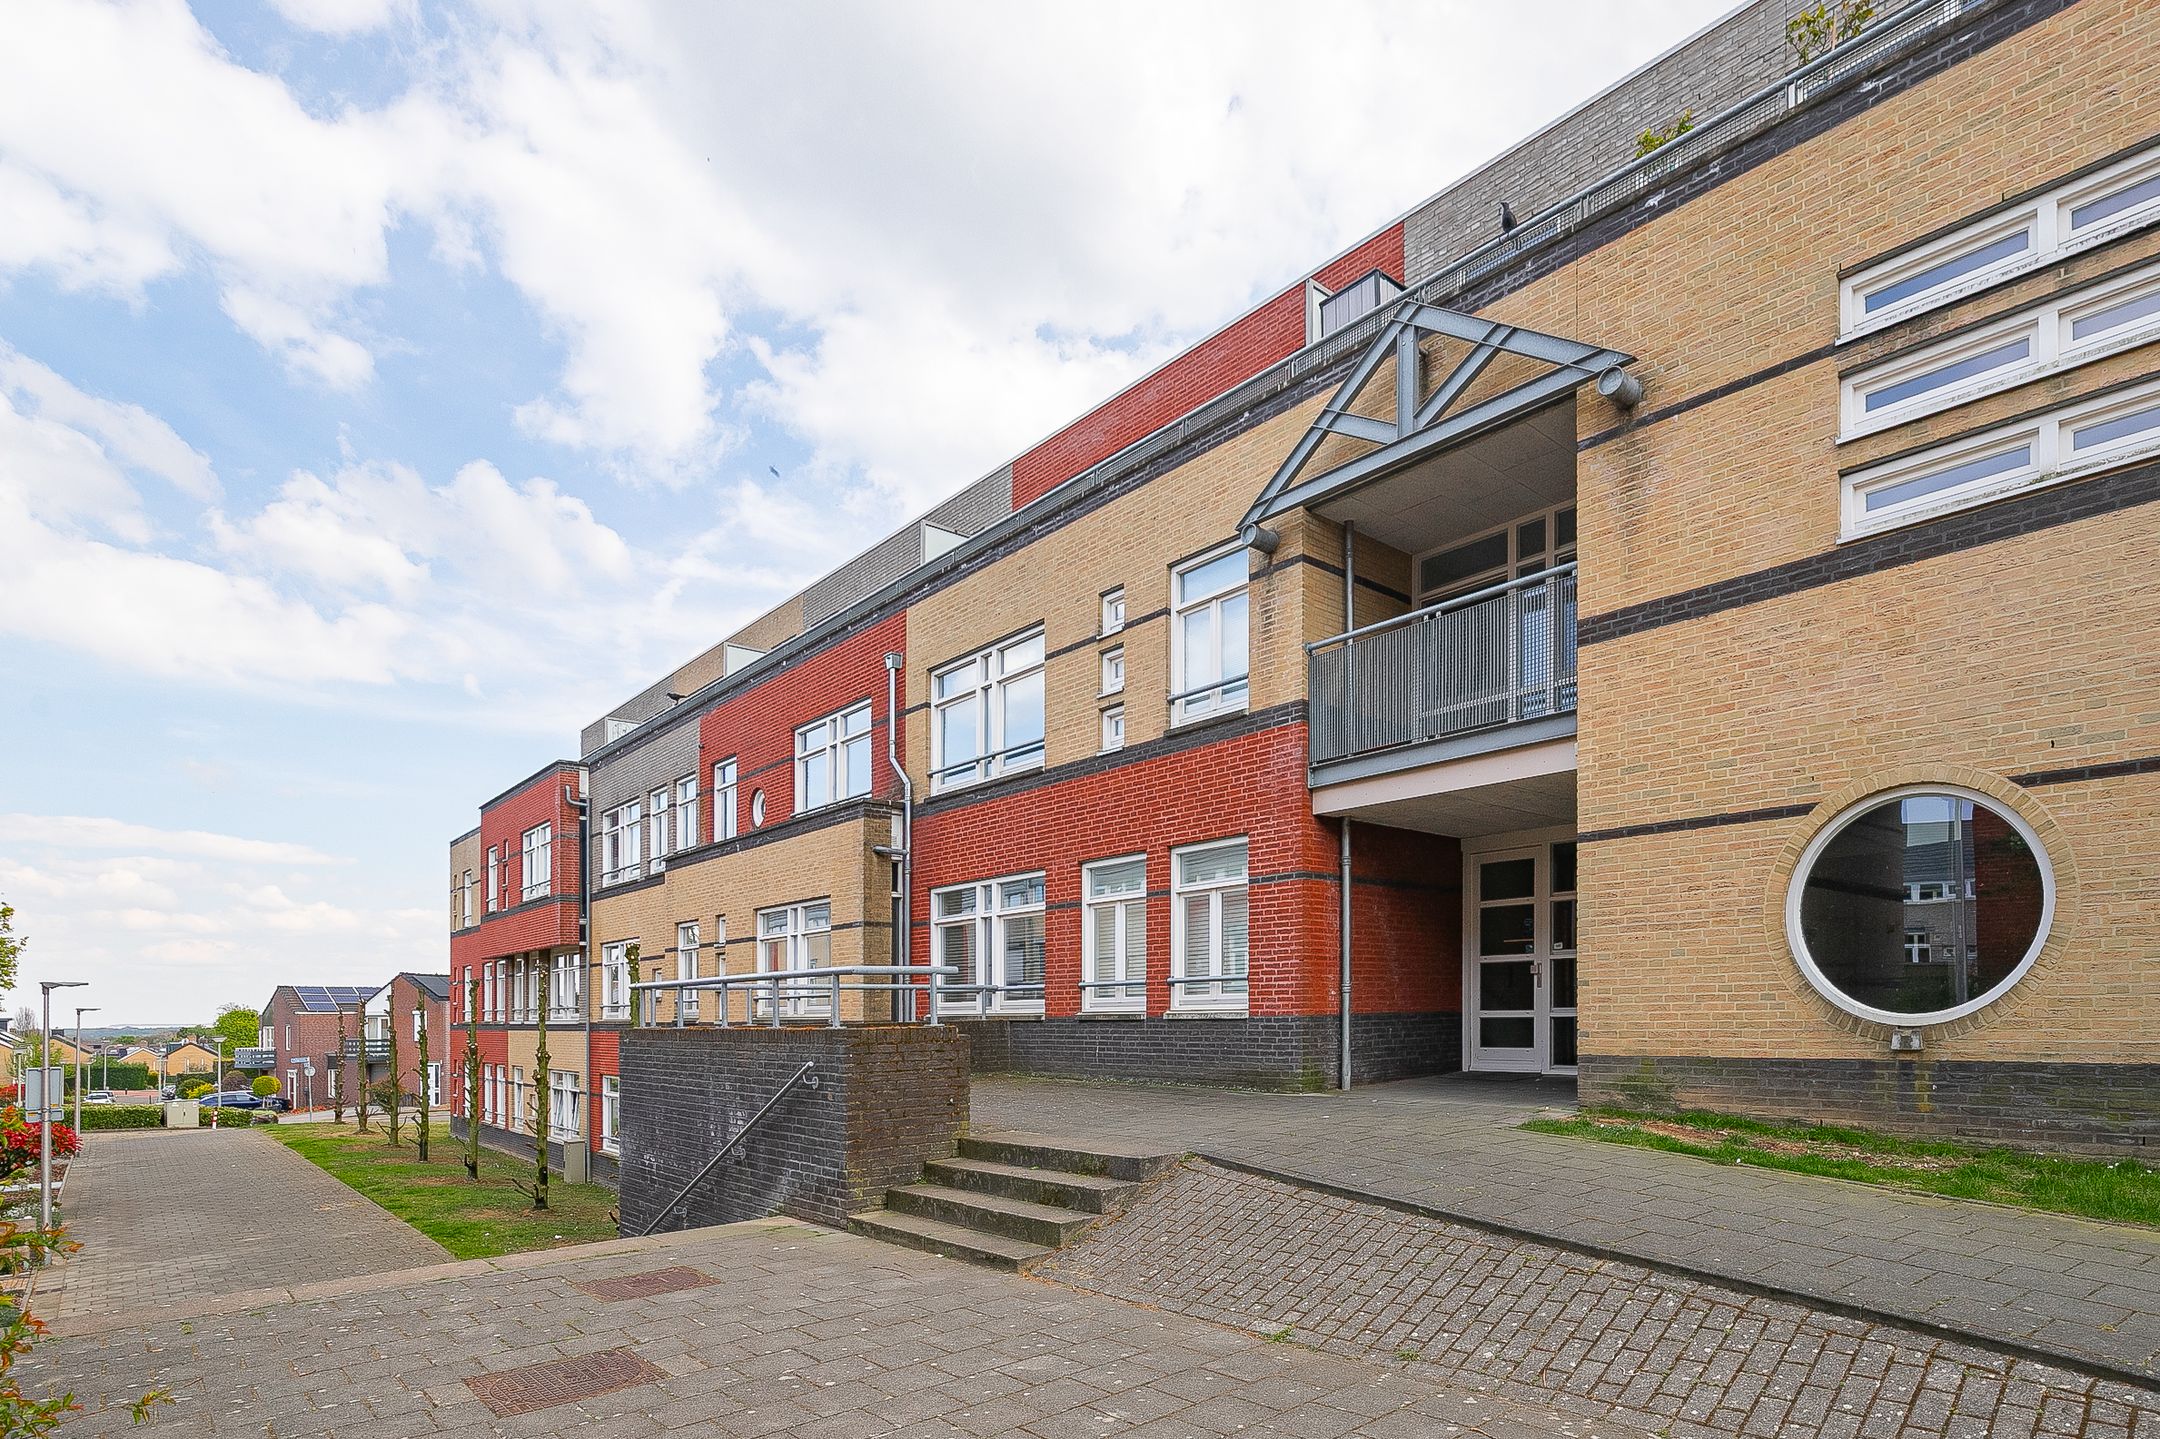
Valder 42 in Landgraaf
- Unlisted
Property main details
€ 1085 /month
- 77 m²
- 2 bedrooms
- Unfurnished
Timeline
- 08 May 2025
- 11 Sep 2025Unlisted
AI Summary
Property
- Bathrooms
- 1
- Energy label
- A
- Floor
- Not mentioned
Availability
- Tenant selection
- Not mentioned
- Detected
- 15 May 2025
- Available from
- Immediately
- Short-term
- No
- React until
- As soon as possible
- Viewing possible
- Not mentioned
Legal
- Contract type
- Model A
- Contract termination
- Initial fixed term, then 1 month
- Registration allowed
- Not mentioned
- WWS points
- Not specified
Building
- Built in
- 2001
- Elevator
- Yes
- Solar panels
- Not mentioned
Financials
- Deposit
- € 2170
- Service costs
- € 40 /month
- Utilities included
- Not mentioned
- Estimated energy cost
- € 180 /month
- Rental allowance
- No
Requirements
- Available for
- Everyone
- Pets
- No restrictions
- Kids
- No restrictions
- Students
- No restrictions
- Entrepreneurs
- No restrictions
- Min annual income
- Single: € 39072Couple: Not mentioned
- Max annual income
- Not mentioned
- Age
- Any age welcome
- Guarantors
- No restrictions
- Sharing
- No restrictions
- Max household size
- No requirements
- Sex restrictions
- No restrictions
- Language
- Everyone welcome
- Residence permit min valid for
- No requirements
Description, briefly
Modern apartment with 2 bedrooms, new kitchen and bathroom, laminate flooring throughout, and private parking. Fully insulated and equipped with a luxury finish.
Location, briefly
Located in the Nieuwenhagen district in the Valder complex, near schools, shopping center, and public transport. Situated along a quiet road in a residential area with private parking.
Reviews of Valder 42
0 reviews
You will remain anonymous, and your name will not be visible.
Places in 1km radius around Valder 42
Uprent is retrieving the location...
Population of Hoefveld (Neighborhood)
- Population
- 1345
- Men
- 650 (48.5%)
- Women
- 690 (51.5%)
Hoefveld - Age
- 0-15
- 11.9%
- 15-25
- 7.4%
- 25-45
- 19.7%
- 45-65
- 26.0%
- 65+
- 34.9%
Crime in Hoefveld in 2024
- Violent crime
- 1.486988847583643
- Non-violent crime
- 11.152416356877323
Public safety
- Public nuisance: 0
- Drug & alcohol nuisance: 0
- Neighborhood nuisance: 0
- Public order disturbance: 0
- Fireworks nuisance: 0
- Trespassing: 0
- Road safety: 8
- Road accidents: 5
- Driving under influence: 2
- Other road offenses: 1
Theft & Damage
- Petty theft: 0
- Shoplifting: 0
- Pickpocketing: 0
- Vandalism: 2
- Transport theft: 3
- Theft in public transport: 0
- Bike & scooter theft: 1
- Car break-ins: 0
- Car theft: 2
- Burglary: 2
- Sheds & garages: 1
- Businesses: 0
- Homes: 1
Violent crime
- Robbery: 1
- Public robbery: 1
- Indoor robbery: 0
- Threat: 1
- Assault: 0
- Group violence: 0
- Homicide: 0
- Arson: 0
- Sexual offense: 0
Hoefveld - Origin
- NL
- 81.4%
- EU
- 12.6%
- Non-EU
- 5.6%
Population of Wijk 01 Nieuwenhagen (District)
- Population
- 9300
- Men
- 4,555 (49.0%)
- Women
- 4,740 (51.0%)
Wijk 01 Nieuwenhagen - Age
- 0-15
- 11.6%
- 15-25
- 8.9%
- 25-45
- 21.4%
- 45-65
- 28.9%
- 65+
- 29.2%
Crime in Wijk 01 Nieuwenhagen in 2024
- Violent crime
- 3.978494623655914
- Non-violent crime
- 28.06451612903226
Public safety
- Public nuisance: 3
- Drug & alcohol nuisance: 0
- Neighborhood nuisance: 0
- Public order disturbance: 1
- Fireworks nuisance: 0
- Trespassing: 2
- Road safety: 79
- Road accidents: 53
- Driving under influence: 18
- Other road offenses: 8
Theft & Damage
- Petty theft: 20
- Shoplifting: 20
- Pickpocketing: 0
- Vandalism: 53
- Transport theft: 67
- Theft in public transport: 19
- Bike & scooter theft: 13
- Car break-ins: 19
- Car theft: 16
- Burglary: 24
- Sheds & garages: 5
- Businesses: 4
- Homes: 15
Violent crime
- Robbery: 2
- Public robbery: 2
- Indoor robbery: 0
- Threat: 16
- Assault: 14
- Group violence: 2
- Homicide: 1
- Arson: 2
- Sexual offense: 0
Wijk 01 Nieuwenhagen - Origin
- NL
- 75.6%
- EU
- 15.6%
- Non-EU
- 8.8%
Population of Landgraaf (City)
- Population
- 37120
- Men
- 18,250 (49.2%)
- Women
- 18,855 (50.8%)
Landgraaf - Age
- 0-15
- 12.7%
- 15-25
- 9.3%
- 25-45
- 21.7%
- 45-65
- 28.9%
- 65+
- 27.5%
Crime in Landgraaf in 2024
- Violent crime
- 3.7984913793103448
- Non-violent crime
- 25.619612068965516
Public safety
- Public nuisance: 13
- Drug & alcohol nuisance: 0
- Neighborhood nuisance: 0
- Public order disturbance: 9
- Fireworks nuisance: 0
- Trespassing: 4
- Road safety: 259
- Road accidents: 140
- Driving under influence: 91
- Other road offenses: 28
Theft & Damage
- Petty theft: 53
- Shoplifting: 48
- Pickpocketing: 5
- Vandalism: 179
- Transport theft: 255
- Theft in public transport: 48
- Bike & scooter theft: 90
- Car break-ins: 65
- Car theft: 52
- Burglary: 93
- Sheds & garages: 22
- Businesses: 16
- Homes: 55
Violent crime
- Robbery: 4
- Public robbery: 4
- Indoor robbery: 0
- Threat: 46
- Assault: 61
- Group violence: 12
- Homicide: 6
- Arson: 12
- Sexual offense: 0
Landgraaf - Origin
- NL
- 75.6%
- EU
- 16.2%
- Non-EU
- 8.3%