Pictures
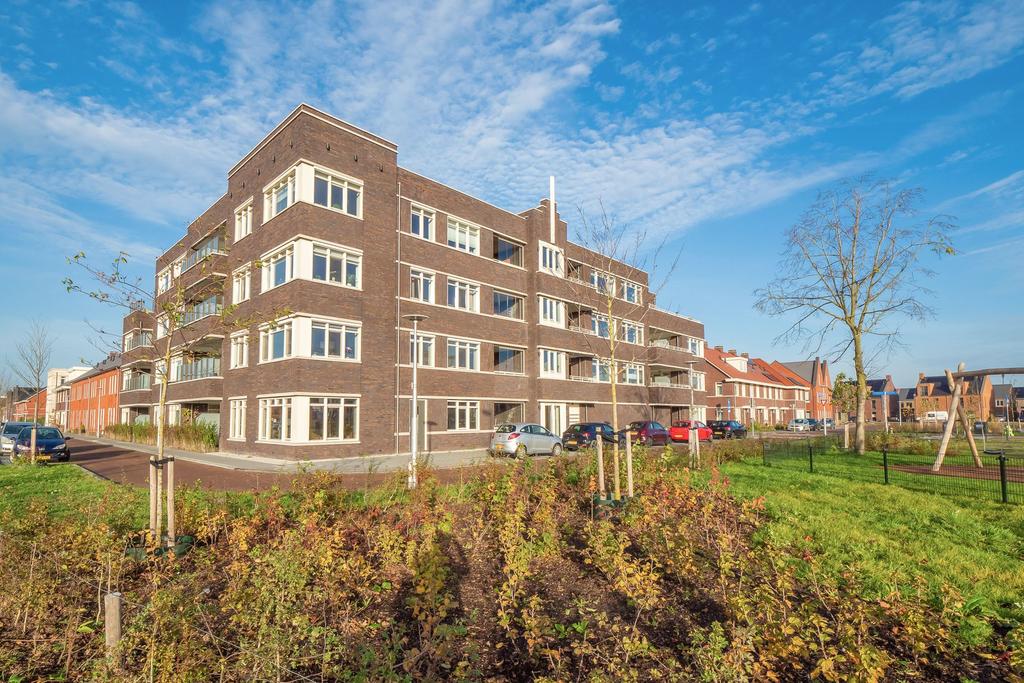
Persimoenstraat in Utrecht
- Unlisted
Property main details
€ 1950 /month
- 80 m²
- 2 bedrooms
Select application message
Timeline
- 31 Mar 2025
- 04 Jun 2025Unlisted
AI Summary
Property
- Bathrooms
- 1
- Energy label
- A
- Floor
- Not mentioned
Availability
- Tenant selection
- Not mentioned
- Detected
- 04 Apr 2025
- Available from
- 01 Jun 2025
- Short-term
- No
- React until
- As soon as possible
- Viewing possible
- Not mentioned
Legal
- Contract type
- Not mentioned
- Contract termination
- Not mentioned
- Registration allowed
- Not mentioned
- WWS points
- Not specified
Building
- Built in
- 2020
- Elevator
- Yes
- Solar panels
- Not mentioned
Financials
- Deposit
- Not mentioned
- Service costs
- No service costs
- Utilities included
- Not mentioned
- Estimated energy cost
- € 184 /month
- Rental allowance
- No
Requirements
- Available for
- Everyone
- Pets
- No restrictions
- Kids
- No restrictions
- Students
- No restrictions
- Entrepreneurs
- No restrictions
- Min annual income
- No explicit requirements, usually 3.5x monthly rent
- Max annual income
- Not mentioned
- Age
- Any age welcome
- Guarantors
- No restrictions
- Sharing
- No restrictions
- Max household size
- No requirements
- Sex restrictions
- No restrictions
- Language
- Everyone welcome
- Residence permit min valid for
- No requirements
Description, briefly
Modern apartment in good condition with 2 bedrooms, 1 bathroom, and a storage box. Fully insulated with district heating and energy label A.
Location, briefly
Located in the quiet Rijnvliet district of Utrecht, on a residential road with an unobstructed view. Public parking and a garage are available nearby.
Reviews of Persimoenstraat
0 reviews
You will remain anonymous, and your name will not be visible.
Places in 1km radius around Persimoenstraat
Uprent is retrieving the location...
Population of Rijnvliet (Neighborhood)
- Population
- 2330
- Men
- 1,145 (49.1%)
- Women
- 1,185 (50.9%)
Rijnvliet - Age
- 0-15
- 31.1%
- 15-25
- 8.8%
- 25-45
- 45.5%
- 45-65
- 12.7%
- 65+
- 1.7%
Crime in Rijnvliet in 2024
- Violent crime
- 0.42918454935622313
- Non-violent crime
- 19.74248927038627
Public safety
- Public nuisance: 0
- Drug & alcohol nuisance: 0
- Neighborhood nuisance: 0
- Public order disturbance: 0
- Fireworks nuisance: 0
- Trespassing: 0
- Road safety: 15
- Road accidents: 8
- Driving under influence: 5
- Other road offenses: 2
Theft & Damage
- Petty theft: 0
- Shoplifting: 0
- Pickpocketing: 0
- Vandalism: 1
- Transport theft: 11
- Theft in public transport: 0
- Bike & scooter theft: 0
- Car break-ins: 11
- Car theft: 0
- Burglary: 15
- Sheds & garages: 3
- Businesses: 4
- Homes: 8
Violent crime
- Robbery: 0
- Public robbery: 0
- Indoor robbery: 0
- Threat: 0
- Assault: 1
- Group violence: 0
- Homicide: 0
- Arson: 0
- Sexual offense: 0
Rijnvliet - Origin
- NL
- 58.4%
- EU
- 6.4%
- Non-EU
- 35.2%
Population of Wijk 09 Leidsche Rijn (District)
- Population
- 49310
- Men
- 24,680 (50.1%)
- Women
- 24,630 (49.9%)
Wijk 09 Leidsche Rijn - Age
- 0-15
- 22.7%
- 15-25
- 10.8%
- 25-45
- 38.0%
- 45-65
- 21.7%
- 65+
- 6.7%
Crime in Wijk 09 Leidsche Rijn in 2024
- Violent crime
- 3.3867369701886028
- Non-violent crime
- 39.931048468870415
Public safety
- Public nuisance: 38
- Drug & alcohol nuisance: 0
- Neighborhood nuisance: 0
- Public order disturbance: 18
- Fireworks nuisance: 0
- Trespassing: 20
- Road safety: 492
- Road accidents: 219
- Driving under influence: 235
- Other road offenses: 38
Theft & Damage
- Petty theft: 106
- Shoplifting: 98
- Pickpocketing: 8
- Vandalism: 161
- Transport theft: 895
- Theft in public transport: 181
- Bike & scooter theft: 351
- Car break-ins: 334
- Car theft: 29
- Burglary: 110
- Sheds & garages: 20
- Businesses: 42
- Homes: 48
Violent crime
- Robbery: 8
- Public robbery: 7
- Indoor robbery: 1
- Threat: 57
- Assault: 83
- Group violence: 9
- Homicide: 2
- Arson: 8
- Sexual offense: 0
Wijk 09 Leidsche Rijn - Origin
- NL
- 53.8%
- EU
- 9.3%
- Non-EU
- 36.9%
Population of Utrecht (City)
- Population
- 323310
- Men
- 157,825 (48.8%)
- Women
- 165,505 (51.2%)
Utrecht - Age
- 0-15
- 14.8%
- 15-25
- 16.0%
- 25-45
- 38.7%
- 45-65
- 20.0%
- 65+
- 10.5%
Crime in Utrecht in 2024
- Violent crime
- 5.5612260678605665
- Non-violent crime
- 57.823760477560235
Public safety
- Public nuisance: 642
- Drug & alcohol nuisance: 0
- Neighborhood nuisance: 4
- Public order disturbance: 407
- Fireworks nuisance: 6
- Trespassing: 225
- Road safety: 2669
- Road accidents: 1685
- Driving under influence: 752
- Other road offenses: 232
Theft & Damage
- Petty theft: 1914
- Shoplifting: 1123
- Pickpocketing: 791
- Vandalism: 1512
- Transport theft: 8405
- Theft in public transport: 1003
- Bike & scooter theft: 4013
- Car break-ins: 3195
- Car theft: 194
- Burglary: 870
- Sheds & garages: 147
- Businesses: 395
- Homes: 328
Violent crime
- Robbery: 60
- Public robbery: 50
- Indoor robbery: 10
- Threat: 556
- Assault: 896
- Group violence: 100
- Homicide: 56
- Arson: 130
- Sexual offense: 0
Utrecht - Origin
- NL
- 58.0%
- EU
- 11.4%
- Non-EU
- 30.6%