Pictures
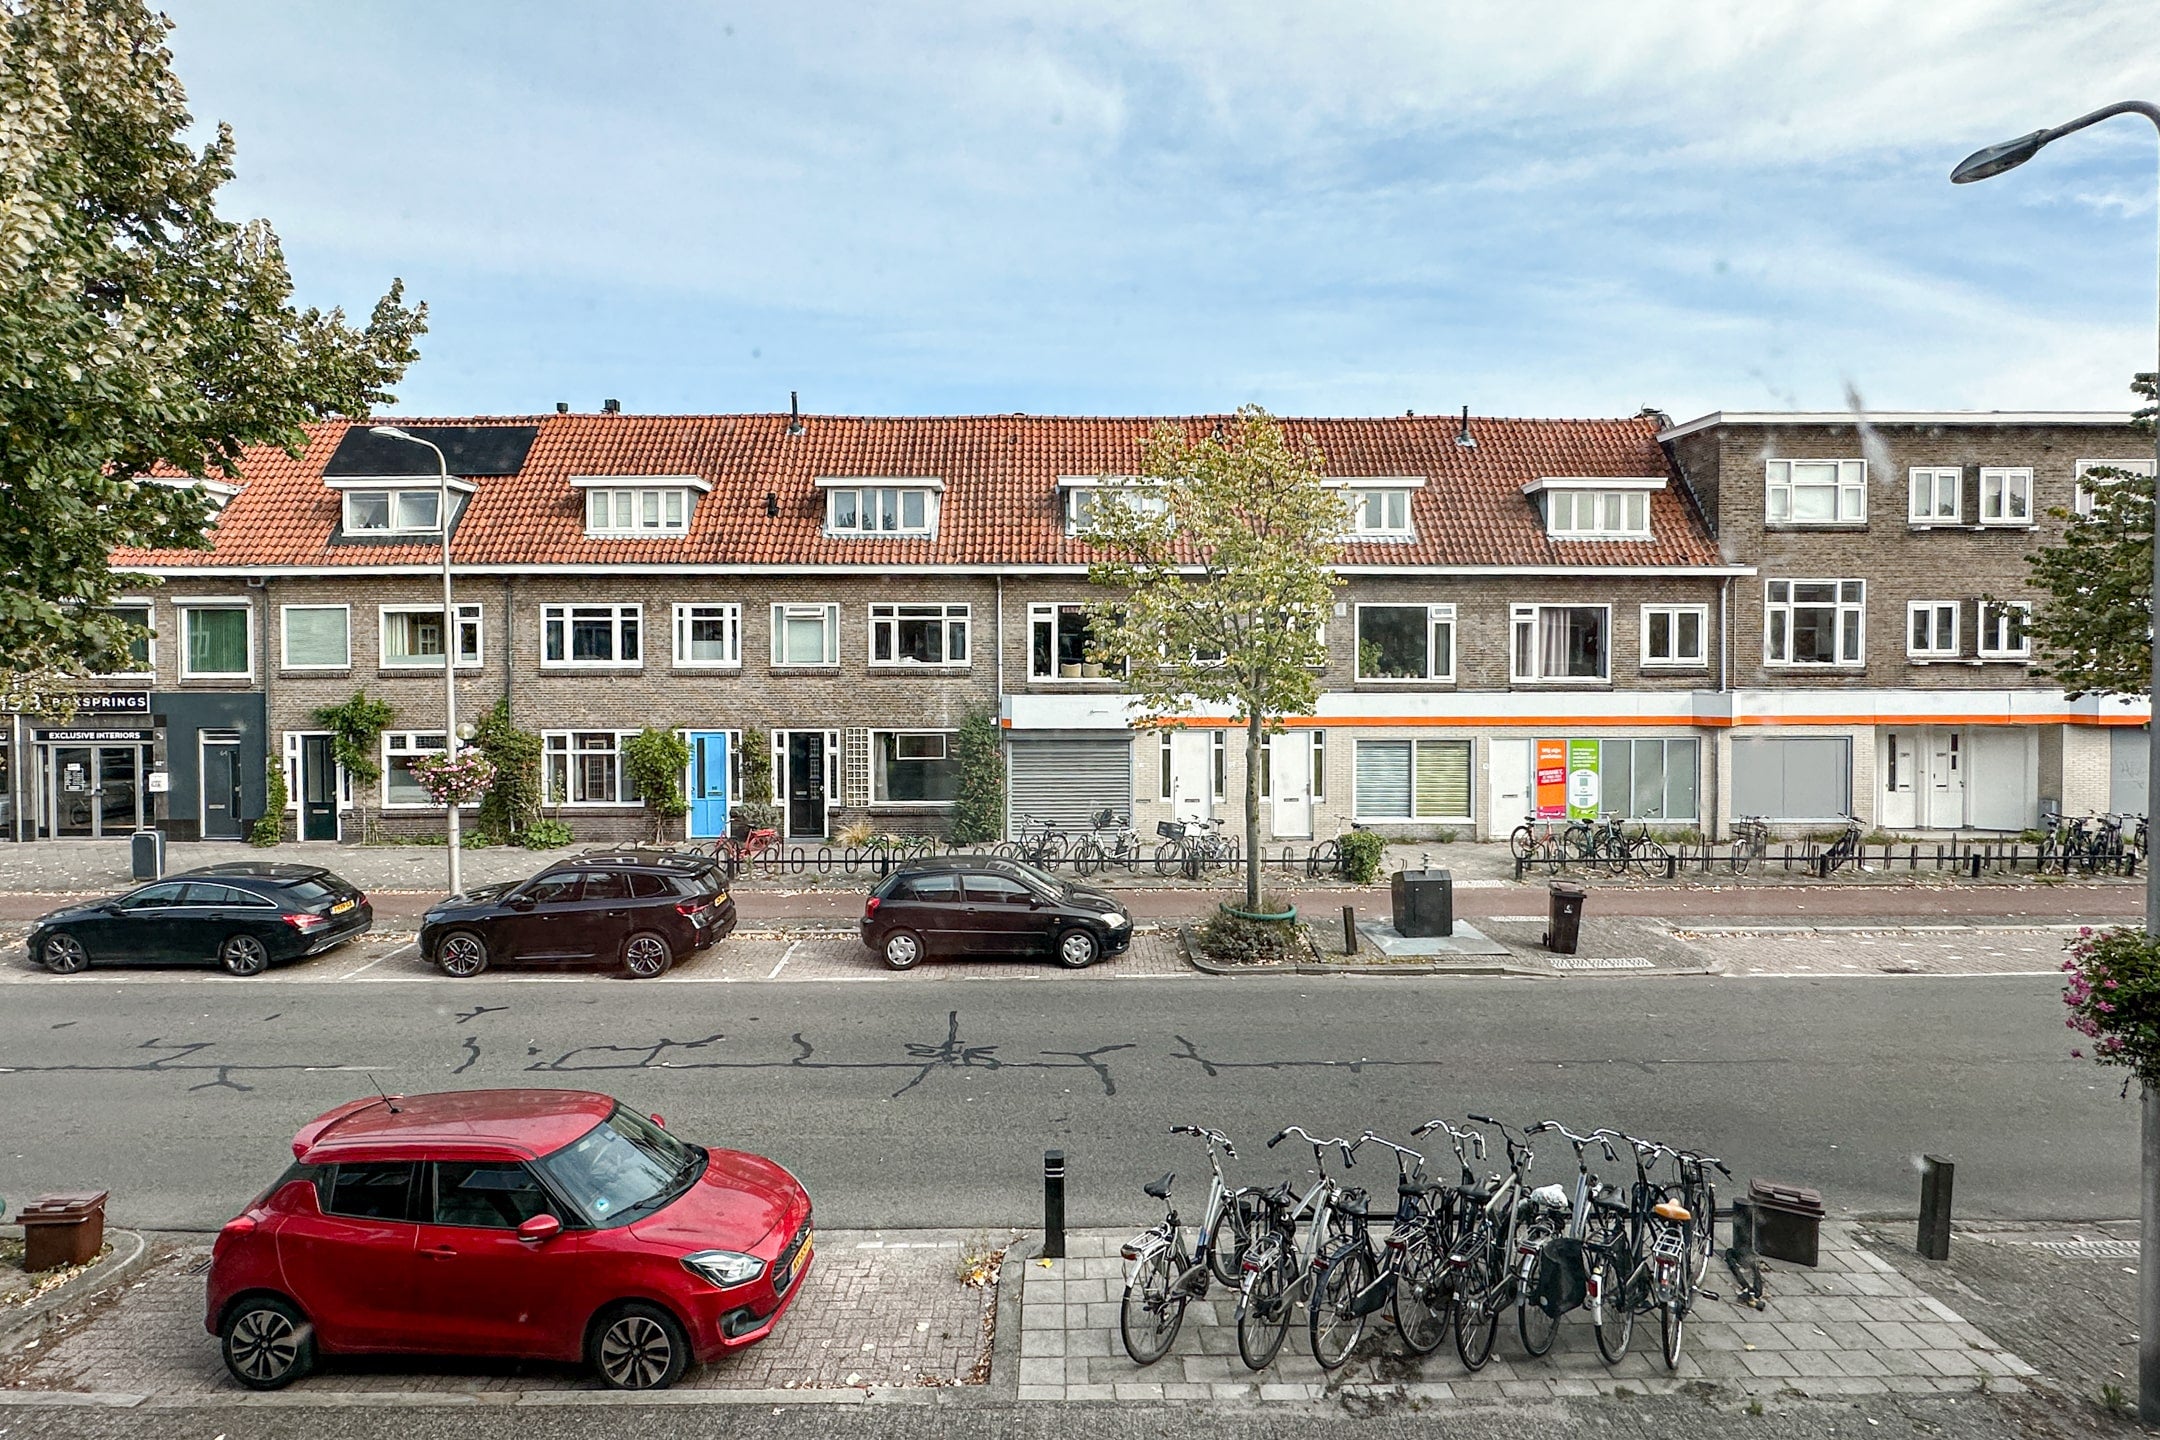
Rijnlaan in Utrecht
- Unlisted
Property main details
€ 2250 /month
- 70 m²
- 2 bedrooms
- Furnished
Select application message
Timeline
- 11 Sep 2025
- 23 Oct 2025Unlisted
AI Summary
Property
- Bathrooms
- 1
- Energy label
- A
- Floor
- Ground floor
Availability
- Tenant selection
- Not mentioned
- Detected
- 11 Sep 2025
- Available from
- 01 Oct 2025
- Short-term
- No
- React until
- As soon as possible
- Viewing possible
- Not mentioned
Legal
- Contract type
- Model A
- Contract termination
- Initial fixed term, then 1 month
- Registration allowed
- Not mentioned
- WWS points
- Not specified
Building
- Built in
- 70
- Elevator
- Not mentioned
- Solar panels
- Not mentioned
Financials
- Deposit
- € 5000
- Service costs
- No service costs
- Utilities included
- No
- Estimated energy cost
- € 171 /month
- Rental allowance
- No
Requirements
- Available for
- Everyone
- Pets
- No restrictions
- Kids
- No restrictions
- Students
- Not allowed
- Entrepreneurs
- No restrictions
- Min annual income
- Single: € 90000Couple: Not mentioned
- Max annual income
- Not mentioned
- Age
- Any age welcome
- Guarantors
- No restrictions
- Sharing
- Not allowed
- Max household size
- No requirements
- Sex restrictions
- No restrictions
- Language
- Everyone welcome
- Residence permit min valid for
- No requirements
Description, briefly
Recently renovated, this furnished 3-room apartment features a modern kitchen, bright living room, and a spacious garden with a shed. The property is in good condition and spread over two floors.
Location, briefly
Located in the popular Rivierenwijk district, within walking distance of shops and a 5-minute bike ride from Utrecht Central Station and the city center.
Reviews of Rijnlaan
0 reviews
You will remain anonymous, and your name will not be visible.
Places in 1km radius around Rijnlaan
Uprent is retrieving the location...
Population of Rivierenwijk (Neighborhood)
- Population
- 9175
- Men
- 4,500 (49.1%)
- Women
- 4,670 (50.9%)
Rivierenwijk - Age
- 0-15
- 14.6%
- 15-25
- 12.5%
- 25-45
- 37.5%
- 45-65
- 23.5%
- 65+
- 11.9%
Crime in Rivierenwijk in 2024
- Violent crime
- 2.7247956403269753
- Non-violent crime
- 24.08719346049046
Public safety
- Public nuisance: 2
- Drug & alcohol nuisance: 0
- Neighborhood nuisance: 1
- Public order disturbance: 1
- Fireworks nuisance: 0
- Trespassing: 0
- Road safety: 45
- Road accidents: 32
- Driving under influence: 11
- Other road offenses: 2
Theft & Damage
- Petty theft: 8
- Shoplifting: 7
- Pickpocketing: 1
- Vandalism: 26
- Transport theft: 108
- Theft in public transport: 16
- Bike & scooter theft: 59
- Car break-ins: 30
- Car theft: 3
- Burglary: 11
- Sheds & garages: 0
- Businesses: 4
- Homes: 7
Violent crime
- Robbery: 0
- Public robbery: 0
- Indoor robbery: 0
- Threat: 5
- Assault: 15
- Group violence: 2
- Homicide: 0
- Arson: 3
- Sexual offense: 0
Rivierenwijk - Origin
- NL
- 64.3%
- EU
- 10.2%
- Non-EU
- 25.4%
Population of Wijk 08 Zuidwest (District)
- Population
- 40830
- Men
- 20,465 (50.1%)
- Women
- 20,370 (49.9%)
Wijk 08 Zuidwest - Age
- 0-15
- 13.9%
- 15-25
- 15.5%
- 25-45
- 42.5%
- 45-65
- 18.5%
- 65+
- 9.6%
Crime in Wijk 08 Zuidwest in 2024
- Violent crime
- 5.26573597844722
- Non-violent crime
- 48.07739407298555
Public safety
- Public nuisance: 39
- Drug & alcohol nuisance: 0
- Neighborhood nuisance: 1
- Public order disturbance: 20
- Fireworks nuisance: 1
- Trespassing: 17
- Road safety: 364
- Road accidents: 265
- Driving under influence: 76
- Other road offenses: 23
Theft & Damage
- Petty theft: 79
- Shoplifting: 62
- Pickpocketing: 17
- Vandalism: 232
- Transport theft: 887
- Theft in public transport: 104
- Bike & scooter theft: 286
- Car break-ins: 469
- Car theft: 28
- Burglary: 127
- Sheds & garages: 25
- Businesses: 55
- Homes: 47
Violent crime
- Robbery: 6
- Public robbery: 4
- Indoor robbery: 2
- Threat: 69
- Assault: 95
- Group violence: 6
- Homicide: 5
- Arson: 34
- Sexual offense: 0
Wijk 08 Zuidwest - Origin
- NL
- 45.6%
- EU
- 11.4%
- Non-EU
- 43.0%
Population of Utrecht (City)
- Population
- 323310
- Men
- 157,825 (48.8%)
- Women
- 165,505 (51.2%)
Utrecht - Age
- 0-15
- 14.8%
- 15-25
- 16.0%
- 25-45
- 38.7%
- 45-65
- 20.0%
- 65+
- 10.5%
Crime in Utrecht in 2024
- Violent crime
- 5.5612260678605665
- Non-violent crime
- 57.823760477560235
Public safety
- Public nuisance: 642
- Drug & alcohol nuisance: 0
- Neighborhood nuisance: 4
- Public order disturbance: 407
- Fireworks nuisance: 6
- Trespassing: 225
- Road safety: 2669
- Road accidents: 1685
- Driving under influence: 752
- Other road offenses: 232
Theft & Damage
- Petty theft: 1914
- Shoplifting: 1123
- Pickpocketing: 791
- Vandalism: 1512
- Transport theft: 8405
- Theft in public transport: 1003
- Bike & scooter theft: 4013
- Car break-ins: 3195
- Car theft: 194
- Burglary: 870
- Sheds & garages: 147
- Businesses: 395
- Homes: 328
Violent crime
- Robbery: 60
- Public robbery: 50
- Indoor robbery: 10
- Threat: 556
- Assault: 896
- Group violence: 100
- Homicide: 56
- Arson: 130
- Sexual offense: 0
Utrecht - Origin
- NL
- 58.0%
- EU
- 11.4%
- Non-EU
- 30.6%